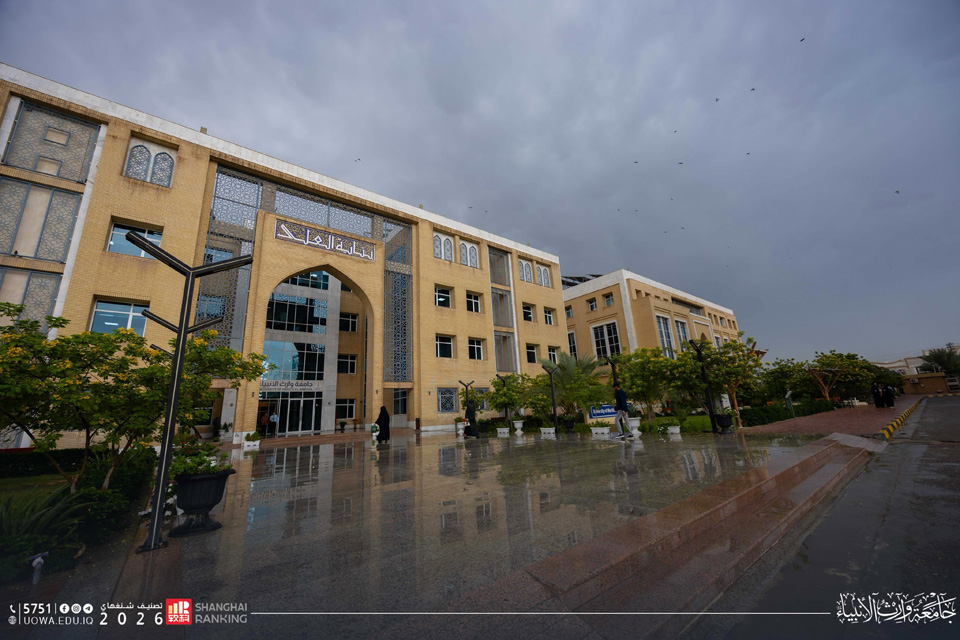
Water Consumption Tracking
Water Consumption Tracking
1. Overview
During 2025, the University of Warith Al-Anbiyaa (UoWA) withdrew 340,000 m³ of water from three sources: the national municipal network, groundwater wells and the river. Every one of these sources is metered with a smart digital meter.
Harvested rainwater is reported separately and is not included in the 340,000 m³ total.
2. Metering of all water sources
Each primary supply point has its own smart digital meter, so all 340,000 m³ withdrawn are measured at the source.
|
Water source |
Metering point |
Meter type |
Number of meters |
|
Municipal / mains water |
Meter at the connection point to the national municipal network |
Smart digital |
1 |
|
Groundwater wells |
Flow meter on each well |
Smart digital |
3 |
|
River water |
Flow meter at the river intake |
Smart digital |
1 |
|
Total |
5 |
3. Metering across university buildings
Water use is monitored across the whole university, covering all 20 buildings. Each building has its own water meter, so consumption can be followed building by building.
|
Indicator |
Status |
|
Buildings monitored |
20 (all buildings) |
|
Buildings with smart digital meters |
15 (75%) |
|
Buildings with mechanical meters |
5 (25%) |
|
Reading and review frequency |
Weekly |
|
Responsible department |
Maintenance and Services Department |
|
Staff responsible for readings |
3 |
|
Data recording |
Excel spreadsheets |
Smart meters log consumption automatically. Each week, the three responsible staff review the logged data and export the readings, together with the mechanical-meter readings, into Excel spreadsheets for verification and record-keeping.
4. Water withdrawal by source, 2025
Mains water supplies two thirds of the 340,000 m³ withdrawn; wells and the river supply the rest.
|
Water source |
Annual volume (m³) |
Share of total |
|
Municipal / mains water |
230,000 |
67.6% |
|
Groundwater wells |
70,000 |
20.6% |
|
River water |
40,000 |
11.8% |
|
Total water withdrawal |
340,000 |
100% |
Reported separately, not included in the total above:
- Harvested rainwater: estimated at 20,000 m³ per year.
- Treated wastewater used for irrigation: 120,000 m³ per year.
5. Use of well and river water
Well and river water supports campus operational needs such as building services, cleaning and landscape irrigation, alongside municipal water. Irrigation is also supplied by treated wastewater, which is reported separately from the 340,000 m³ withdrawal total.
6. Verification and monitoring
The Maintenance and Services Department verifies the 2025 figures source by source, using the records that exist for each one:
- Mains water: meter readings are compared with municipal water invoices.
- Wells: meter readings are compared with pump operating logs.
- River intake: meter readings are compared with pump operating logs.
- Buildings: weekly readings are compared with maintenance records to spot abnormal consumption.
This process supports the review of consumption patterns and helps identify discrepancies and operational issues.
7. Leak detection and repair
During 2025, the university identified and repaired 15 water leaks. Repair records are kept by the Maintenance and Services Department and are available as supporting evidence.

Sustainability at UOWA
The University of Warith Al-Anbiyaa Sustainability Website is the University’s official platform for documenting and publishing its sustainability work. It brings together evidence, policies,
RECENT POST
-
Student Union
26 October, 2026
-

NGOs Collaboration
26 October, 2026
-

Outreach & Engagement
26 October, 2026